.png&w=1920&q=75)
Taco Tech Analytics Dashboard
Automated Square data integration with a dynamic Softr dashboard for Taco Tech’s business insights.
The problem
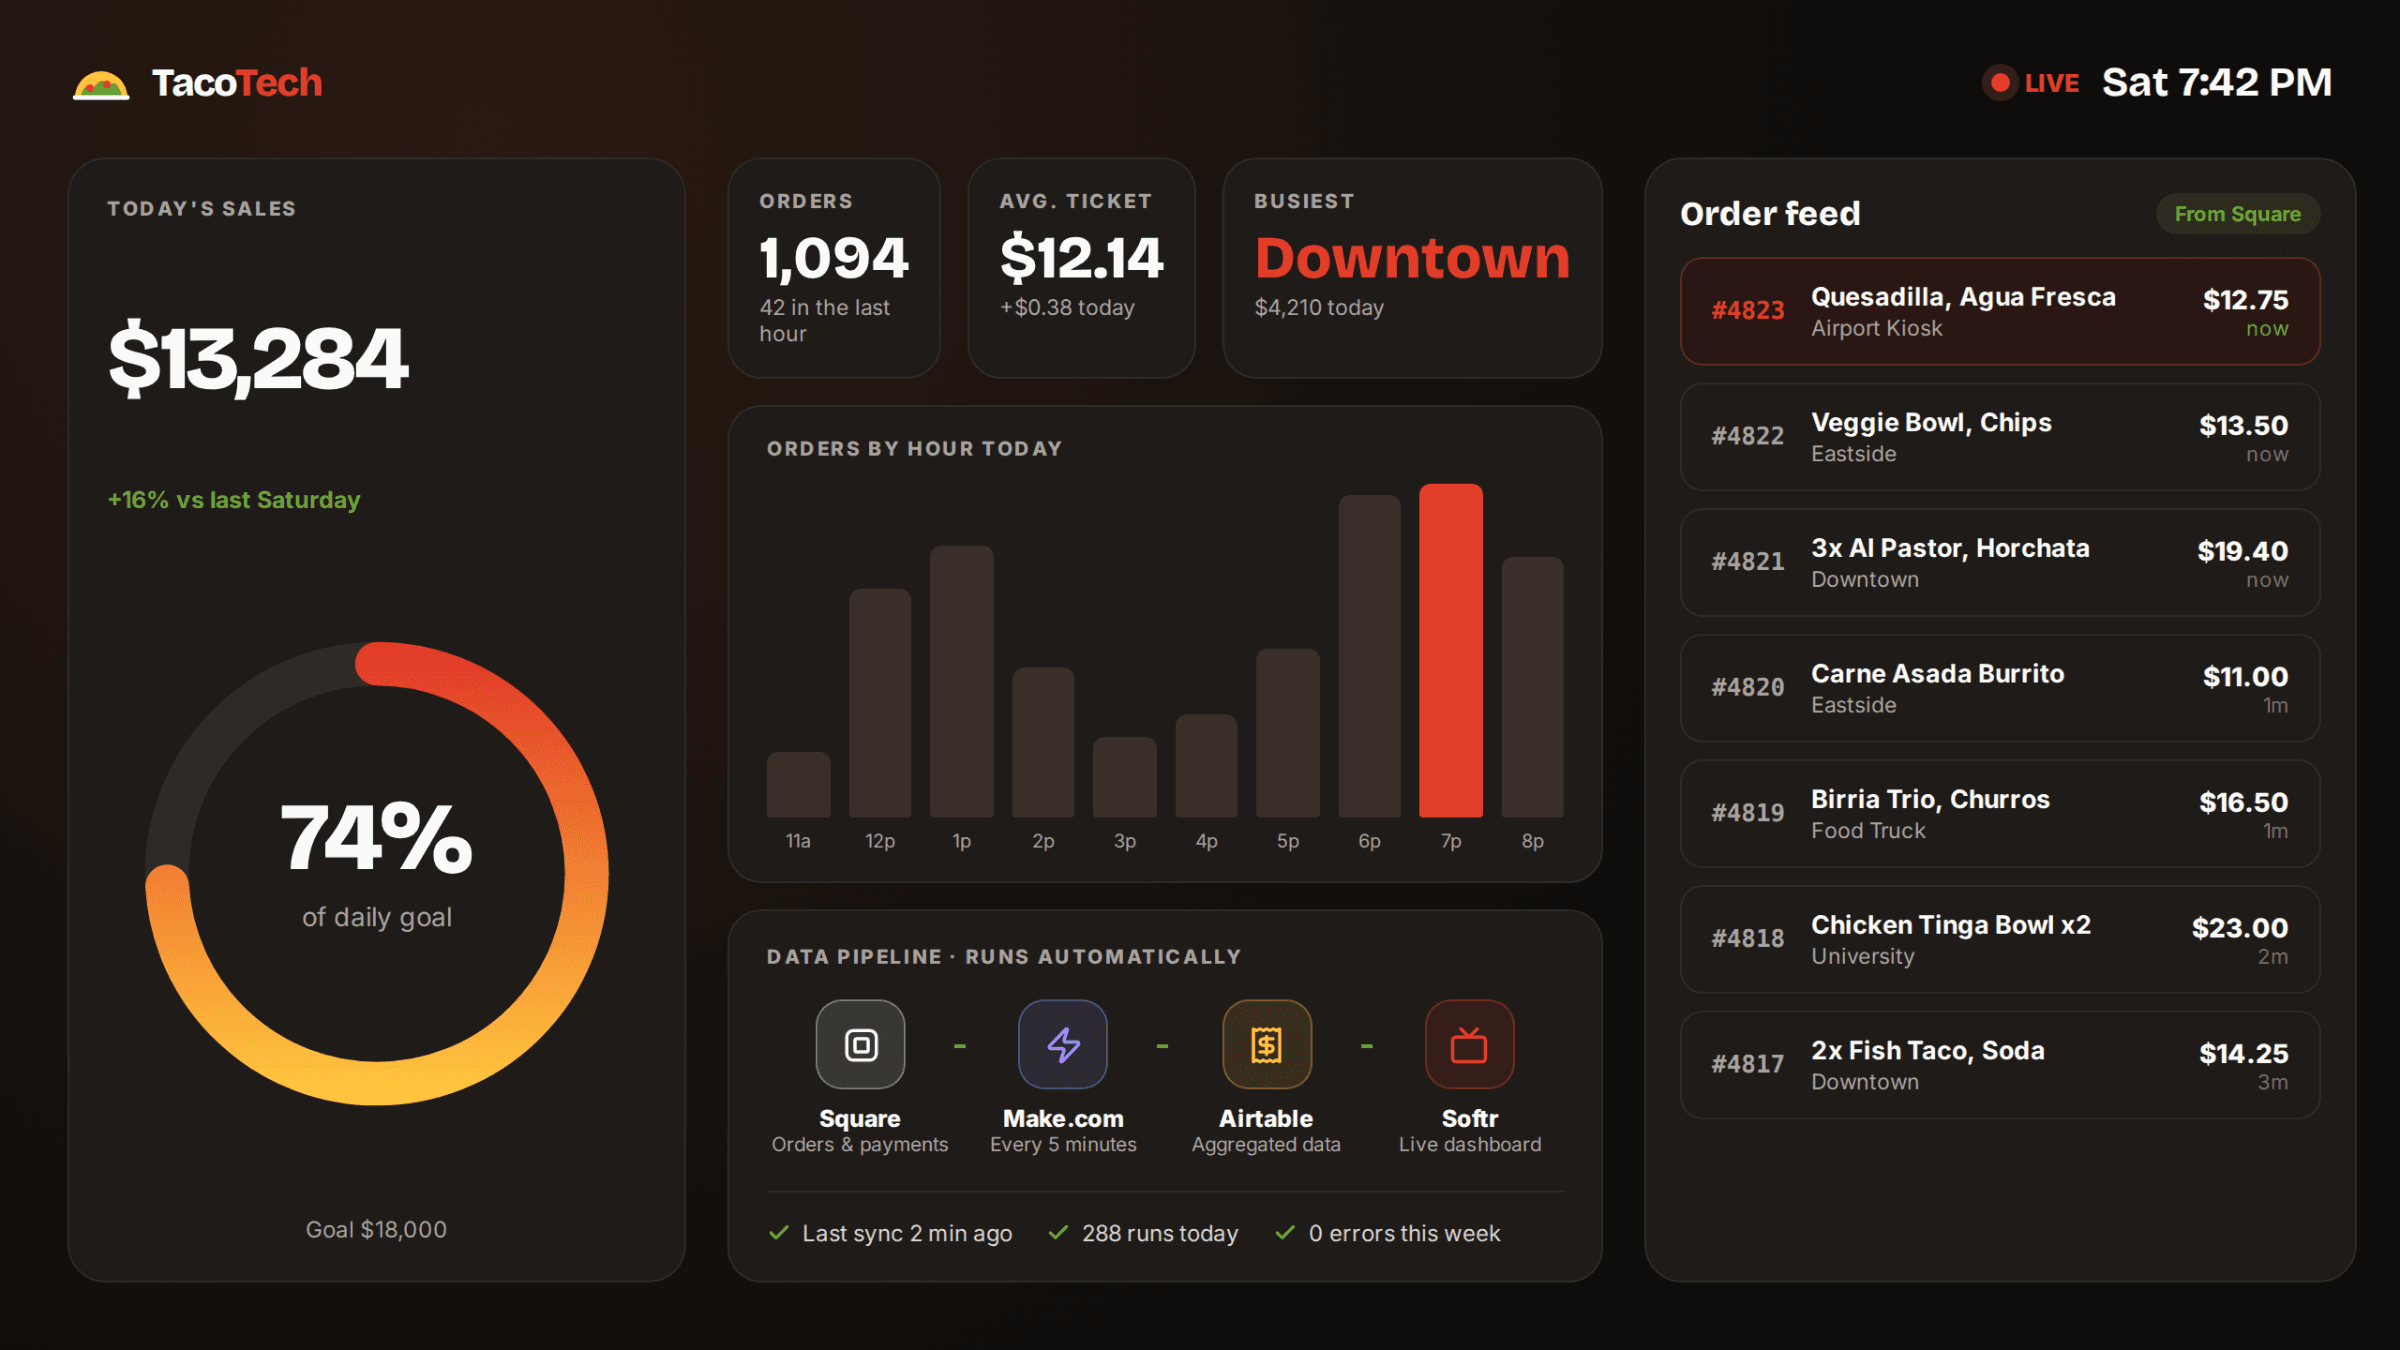
The project aimed to create an integrated analytics and reporting dashboard for Taco Tech, a restaurant operations group managed by Gabriel. The goal was to automate the process of extracting key sales and performance data from Square and transforming it into a visually rich dashboard using Make.com and Softr. Gabriel provided Square access credentials, and the automation setup was completed using Make’s Pro plan. The dashboard aggregates Square data, provides real-time sales insights, and generates performance metrics for decision-making. Throughout the collaboration, regular Google Meet demos ensured alignment on dashboard metrics, automation workflows, and visual design.
What we built
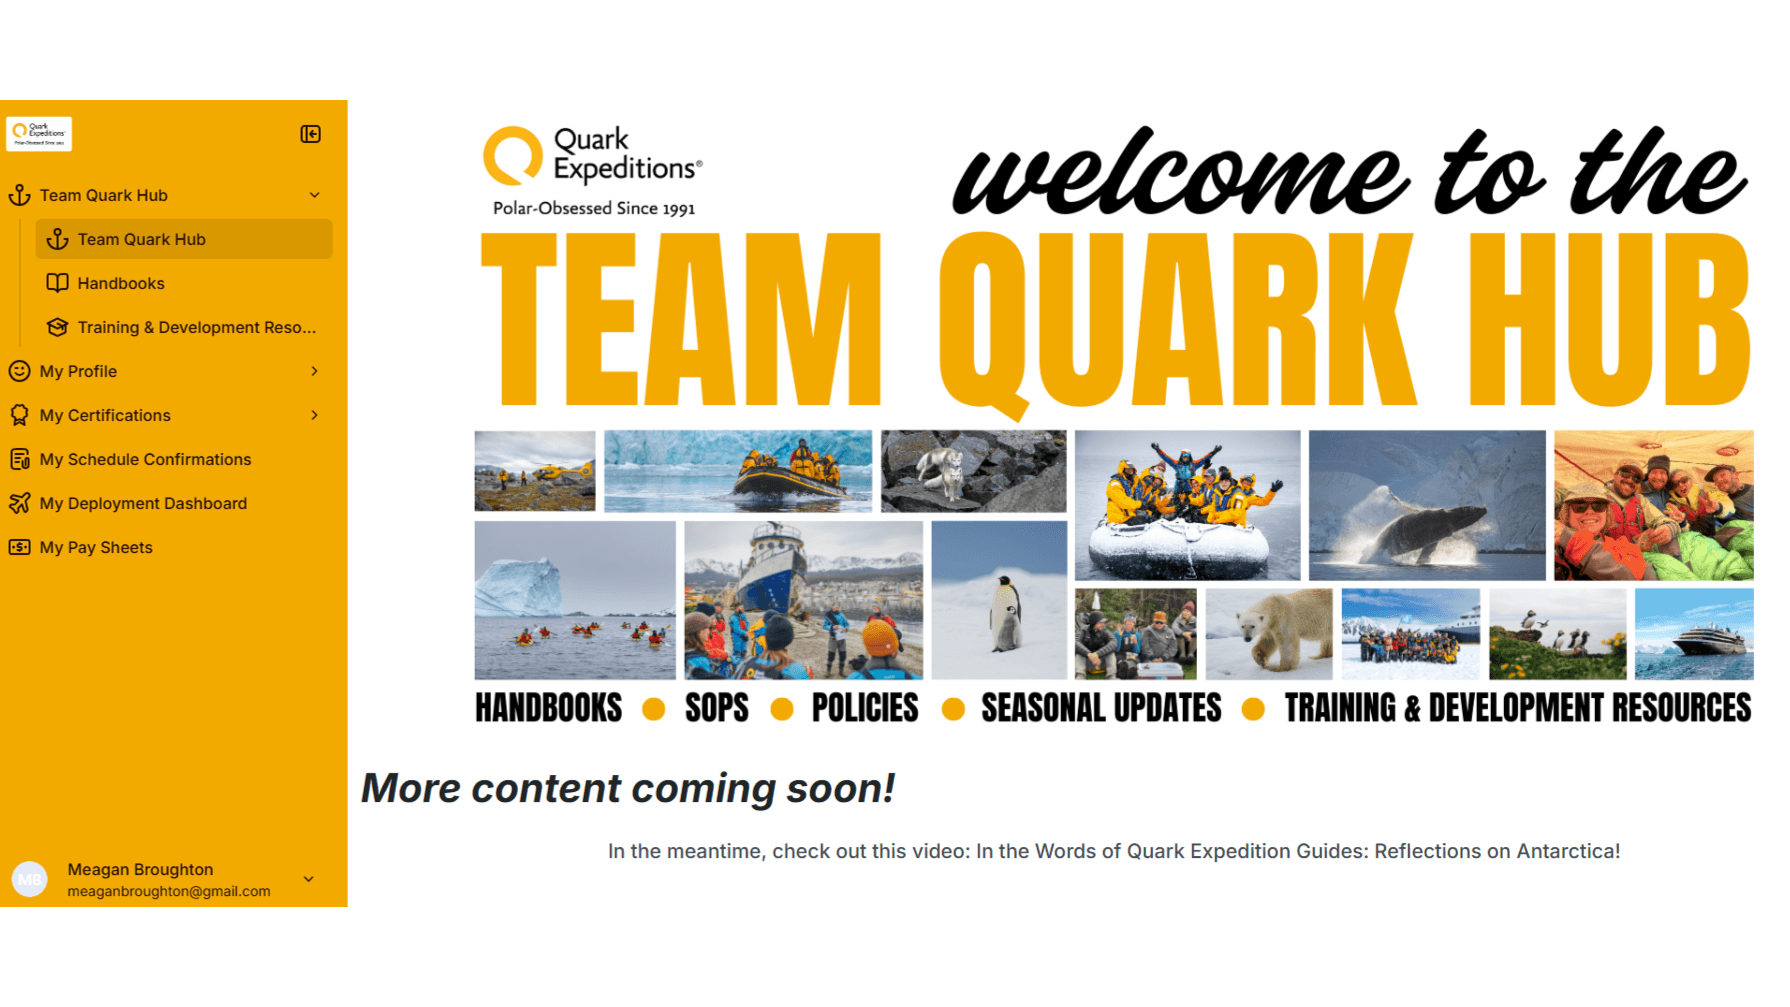
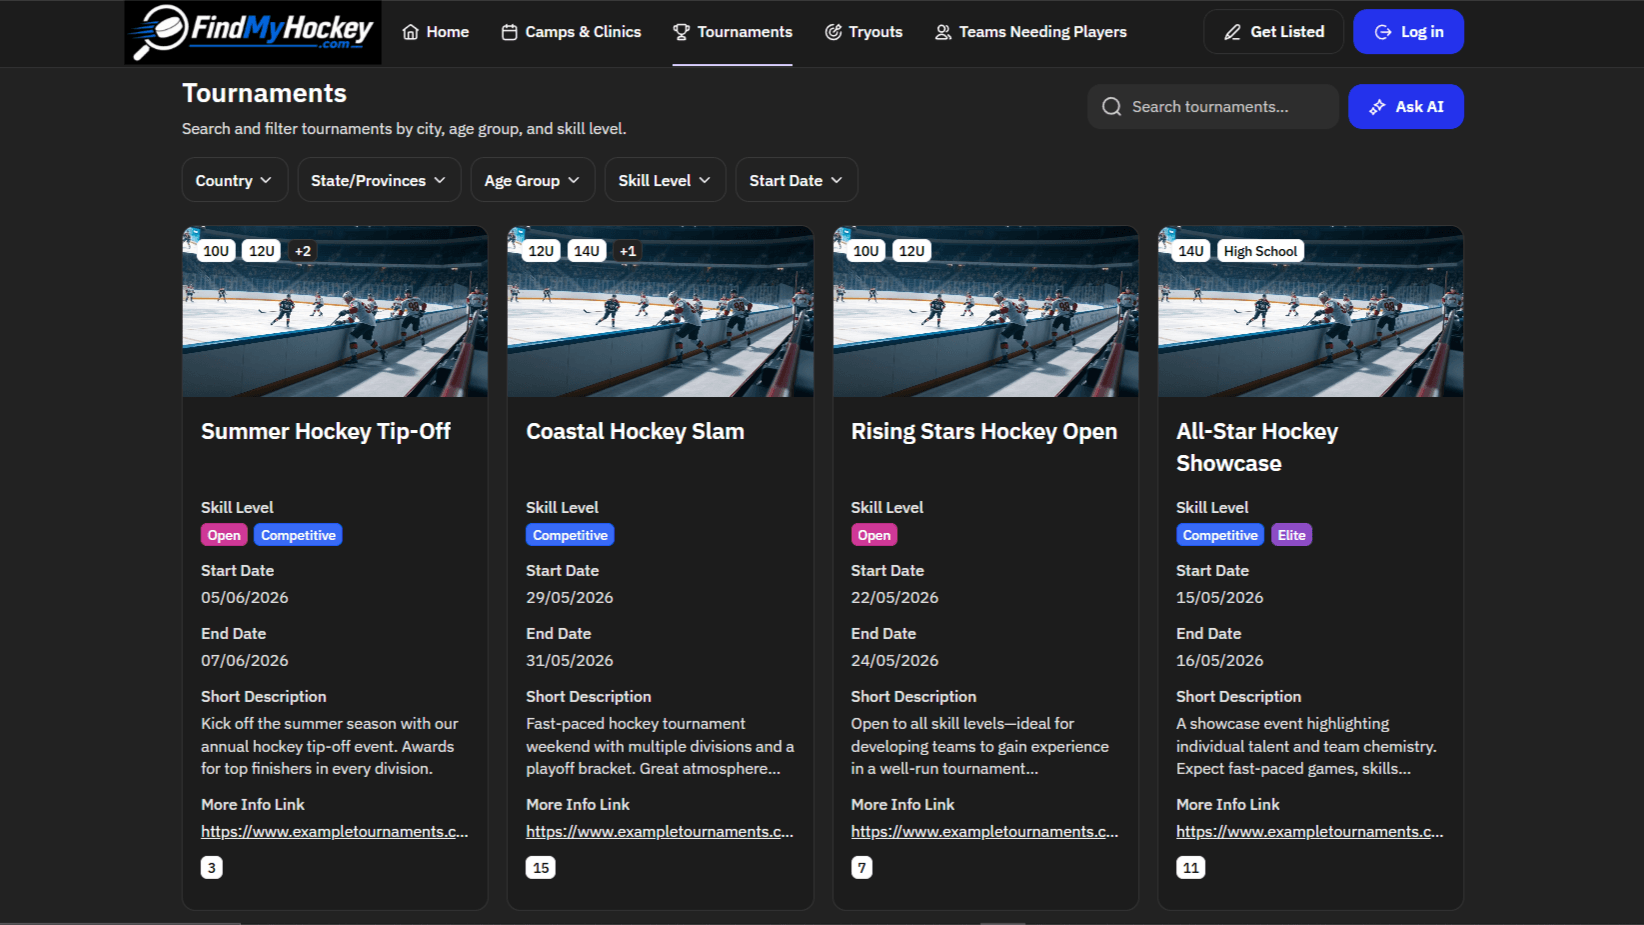
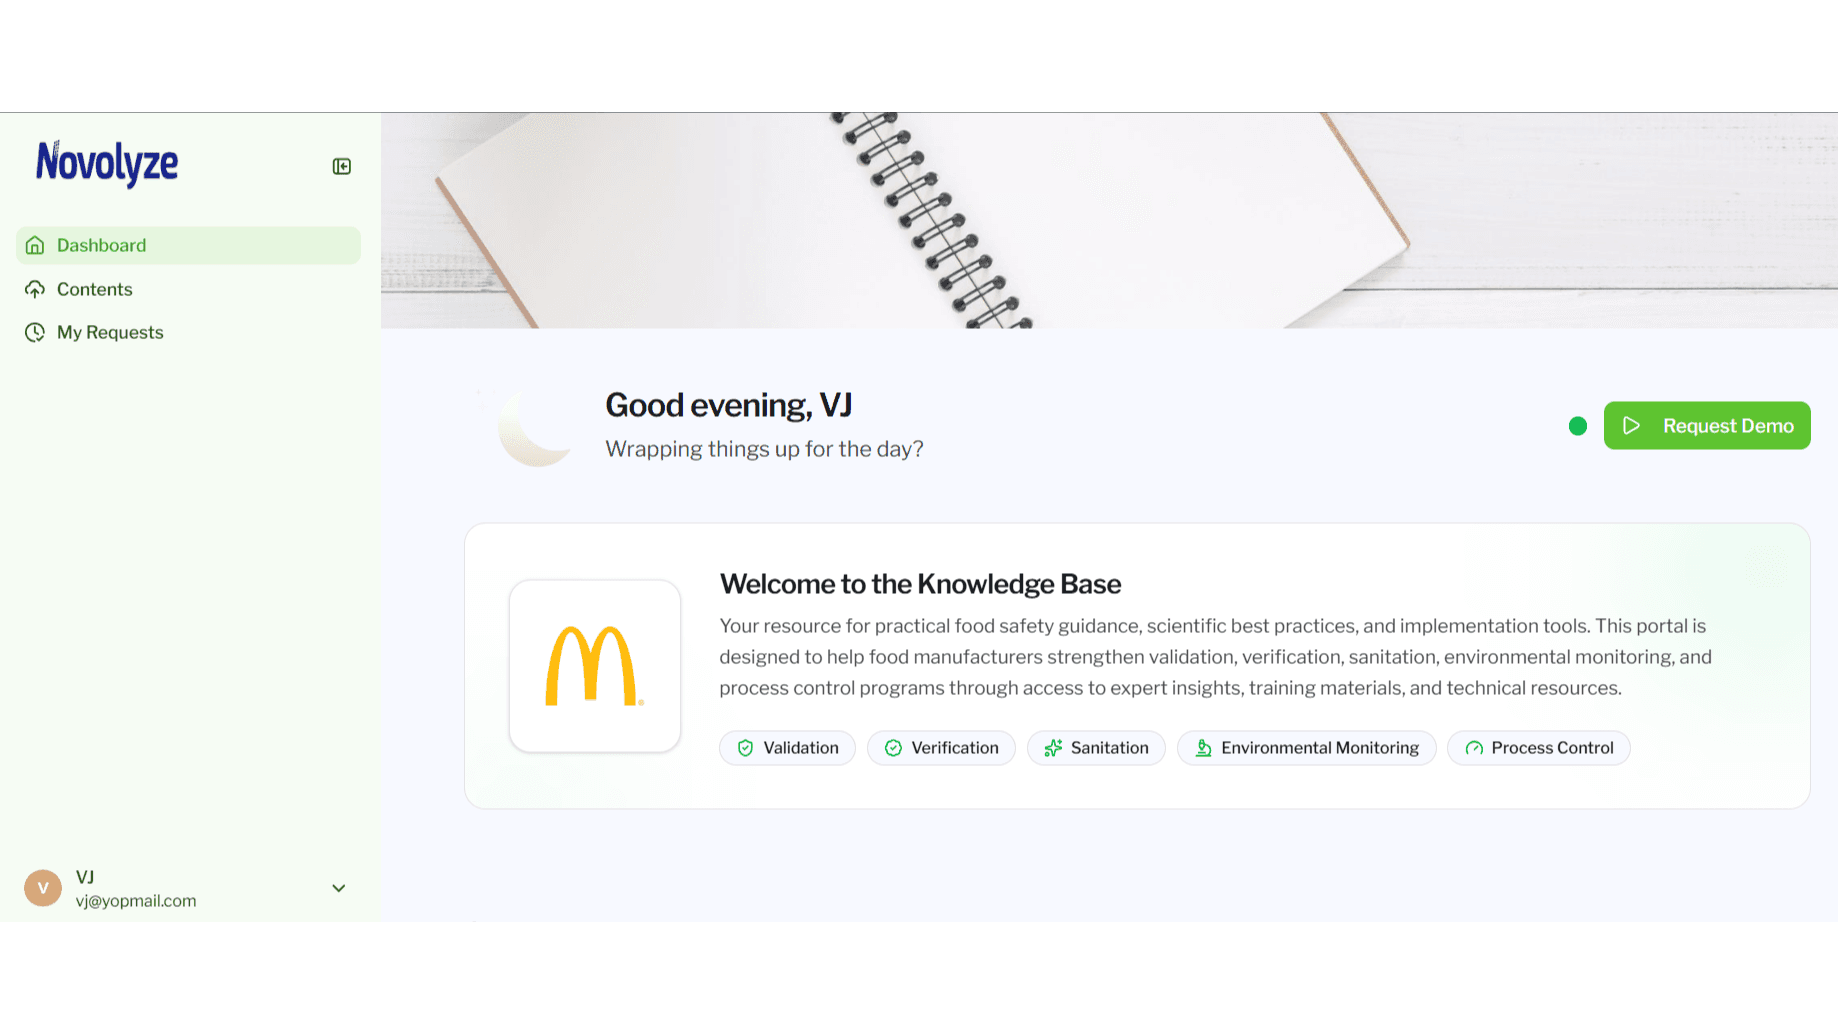
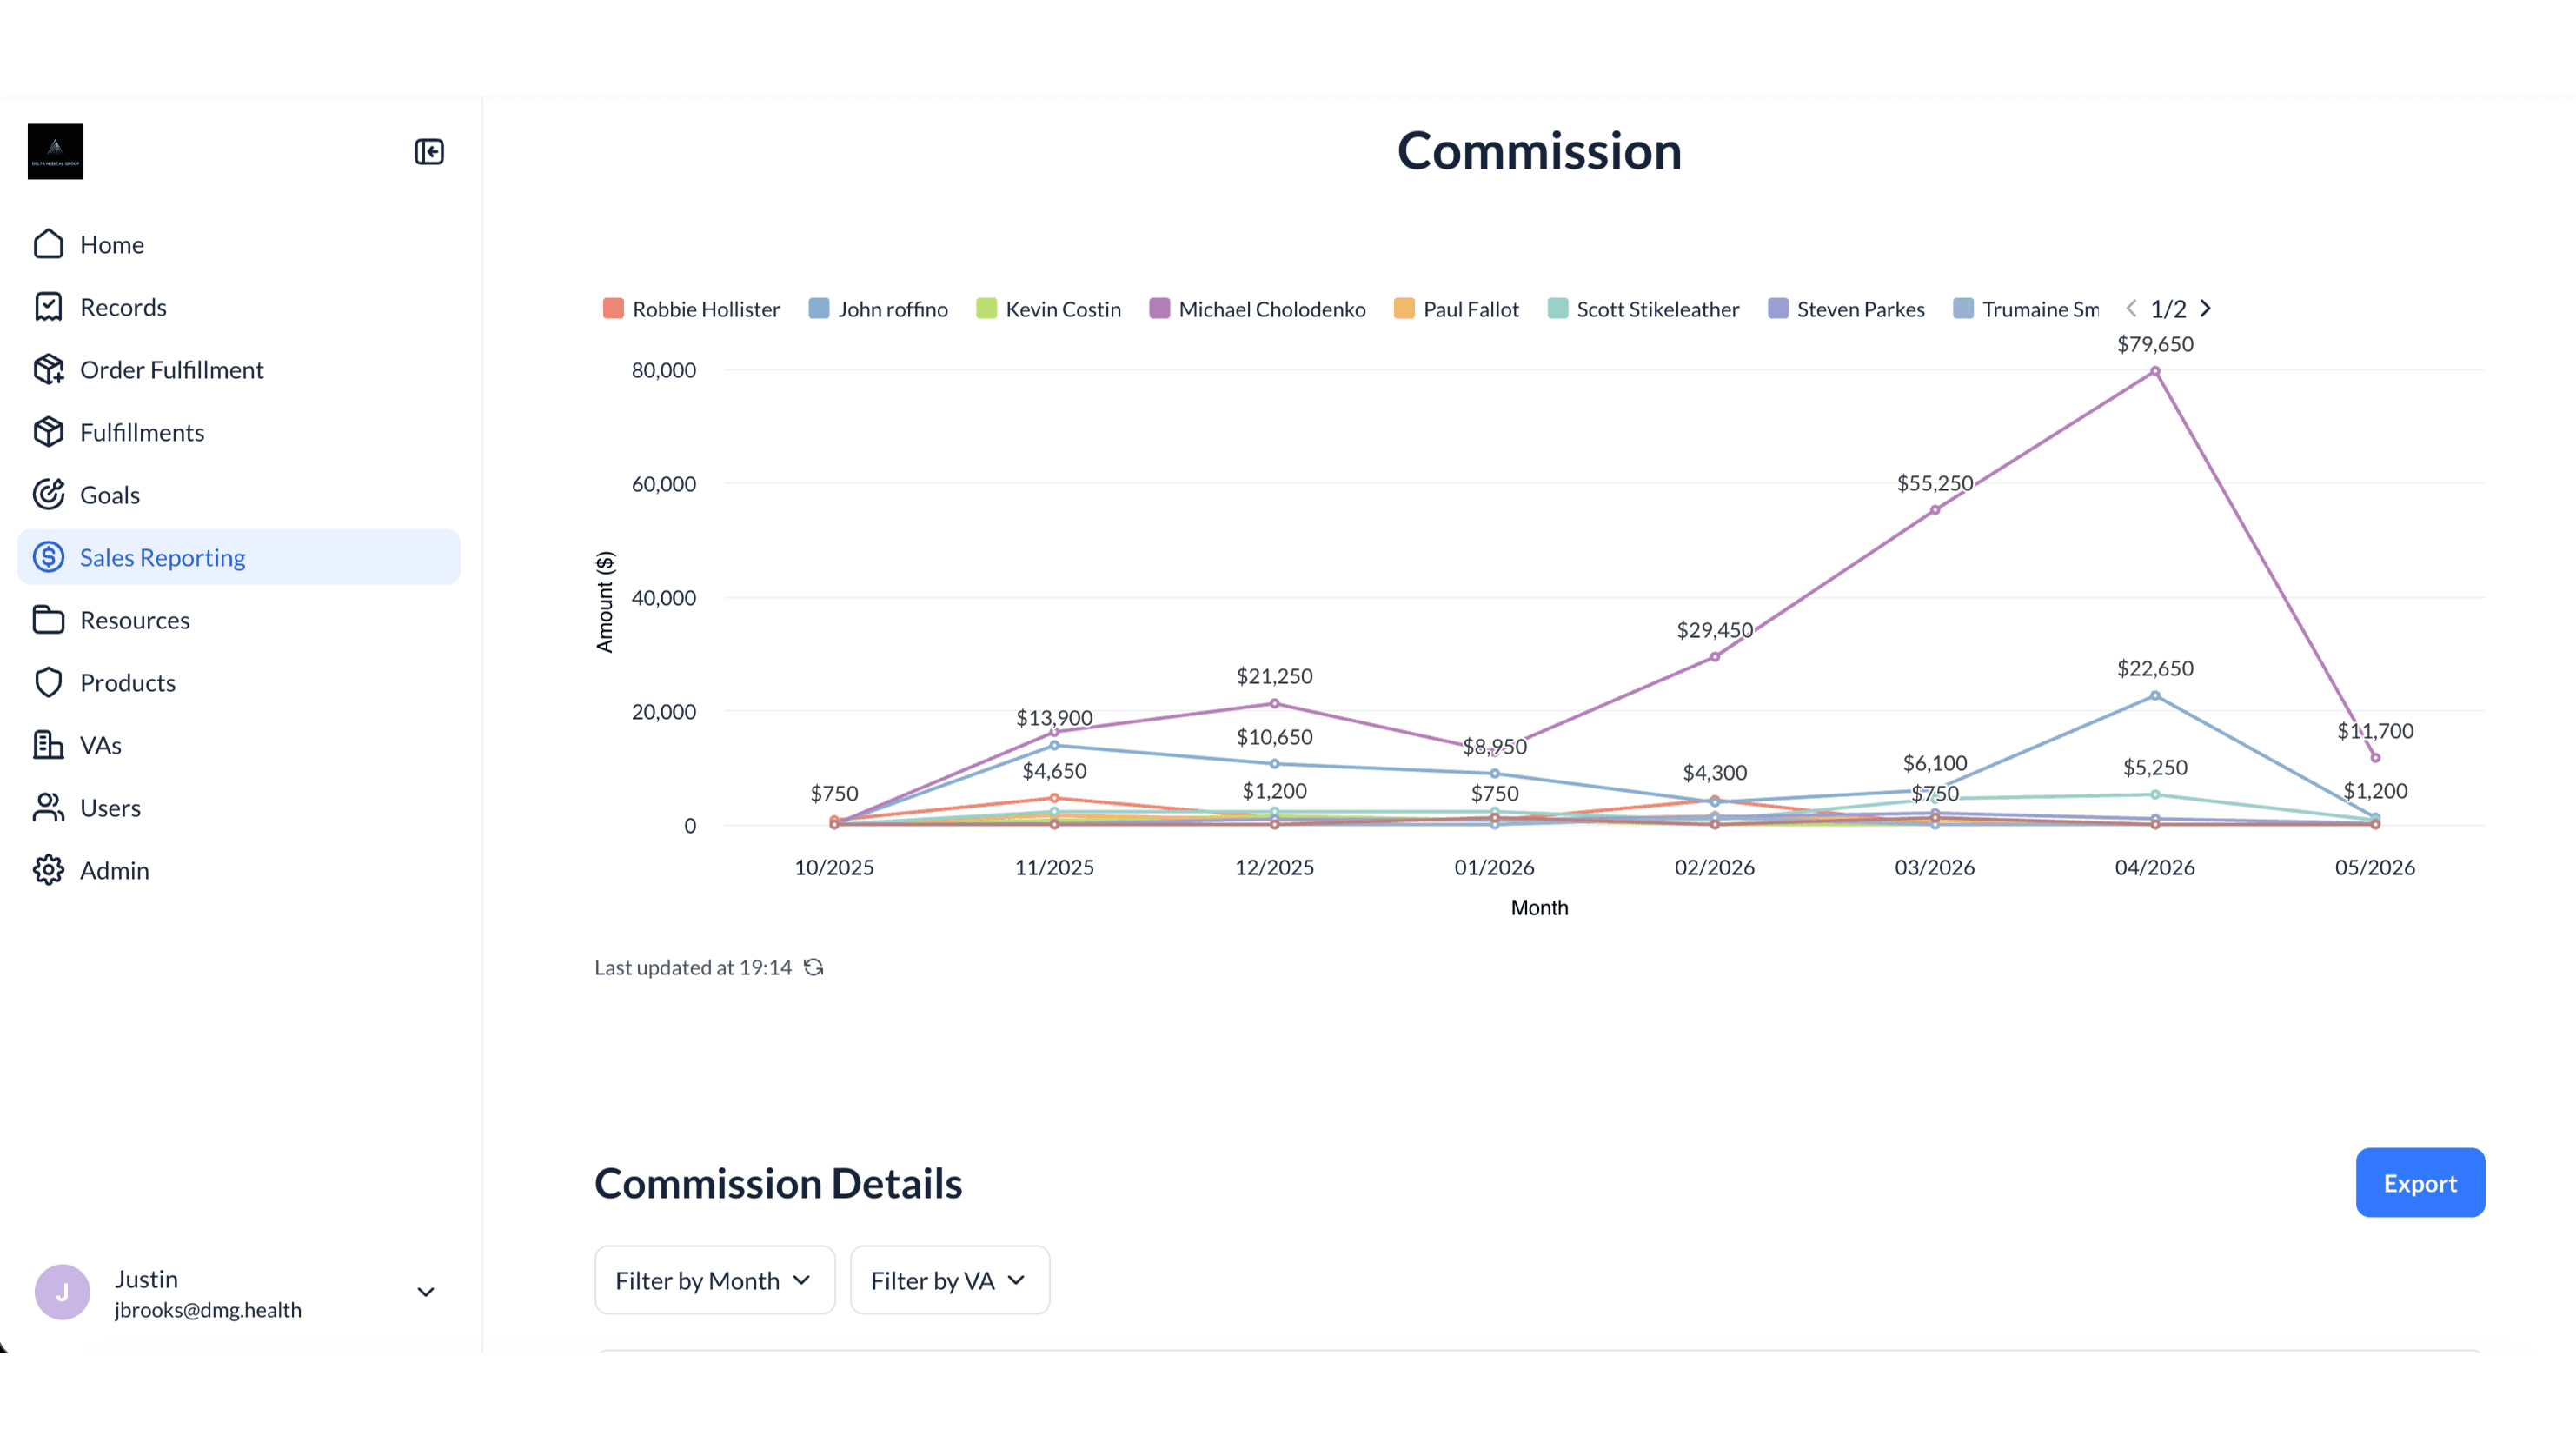
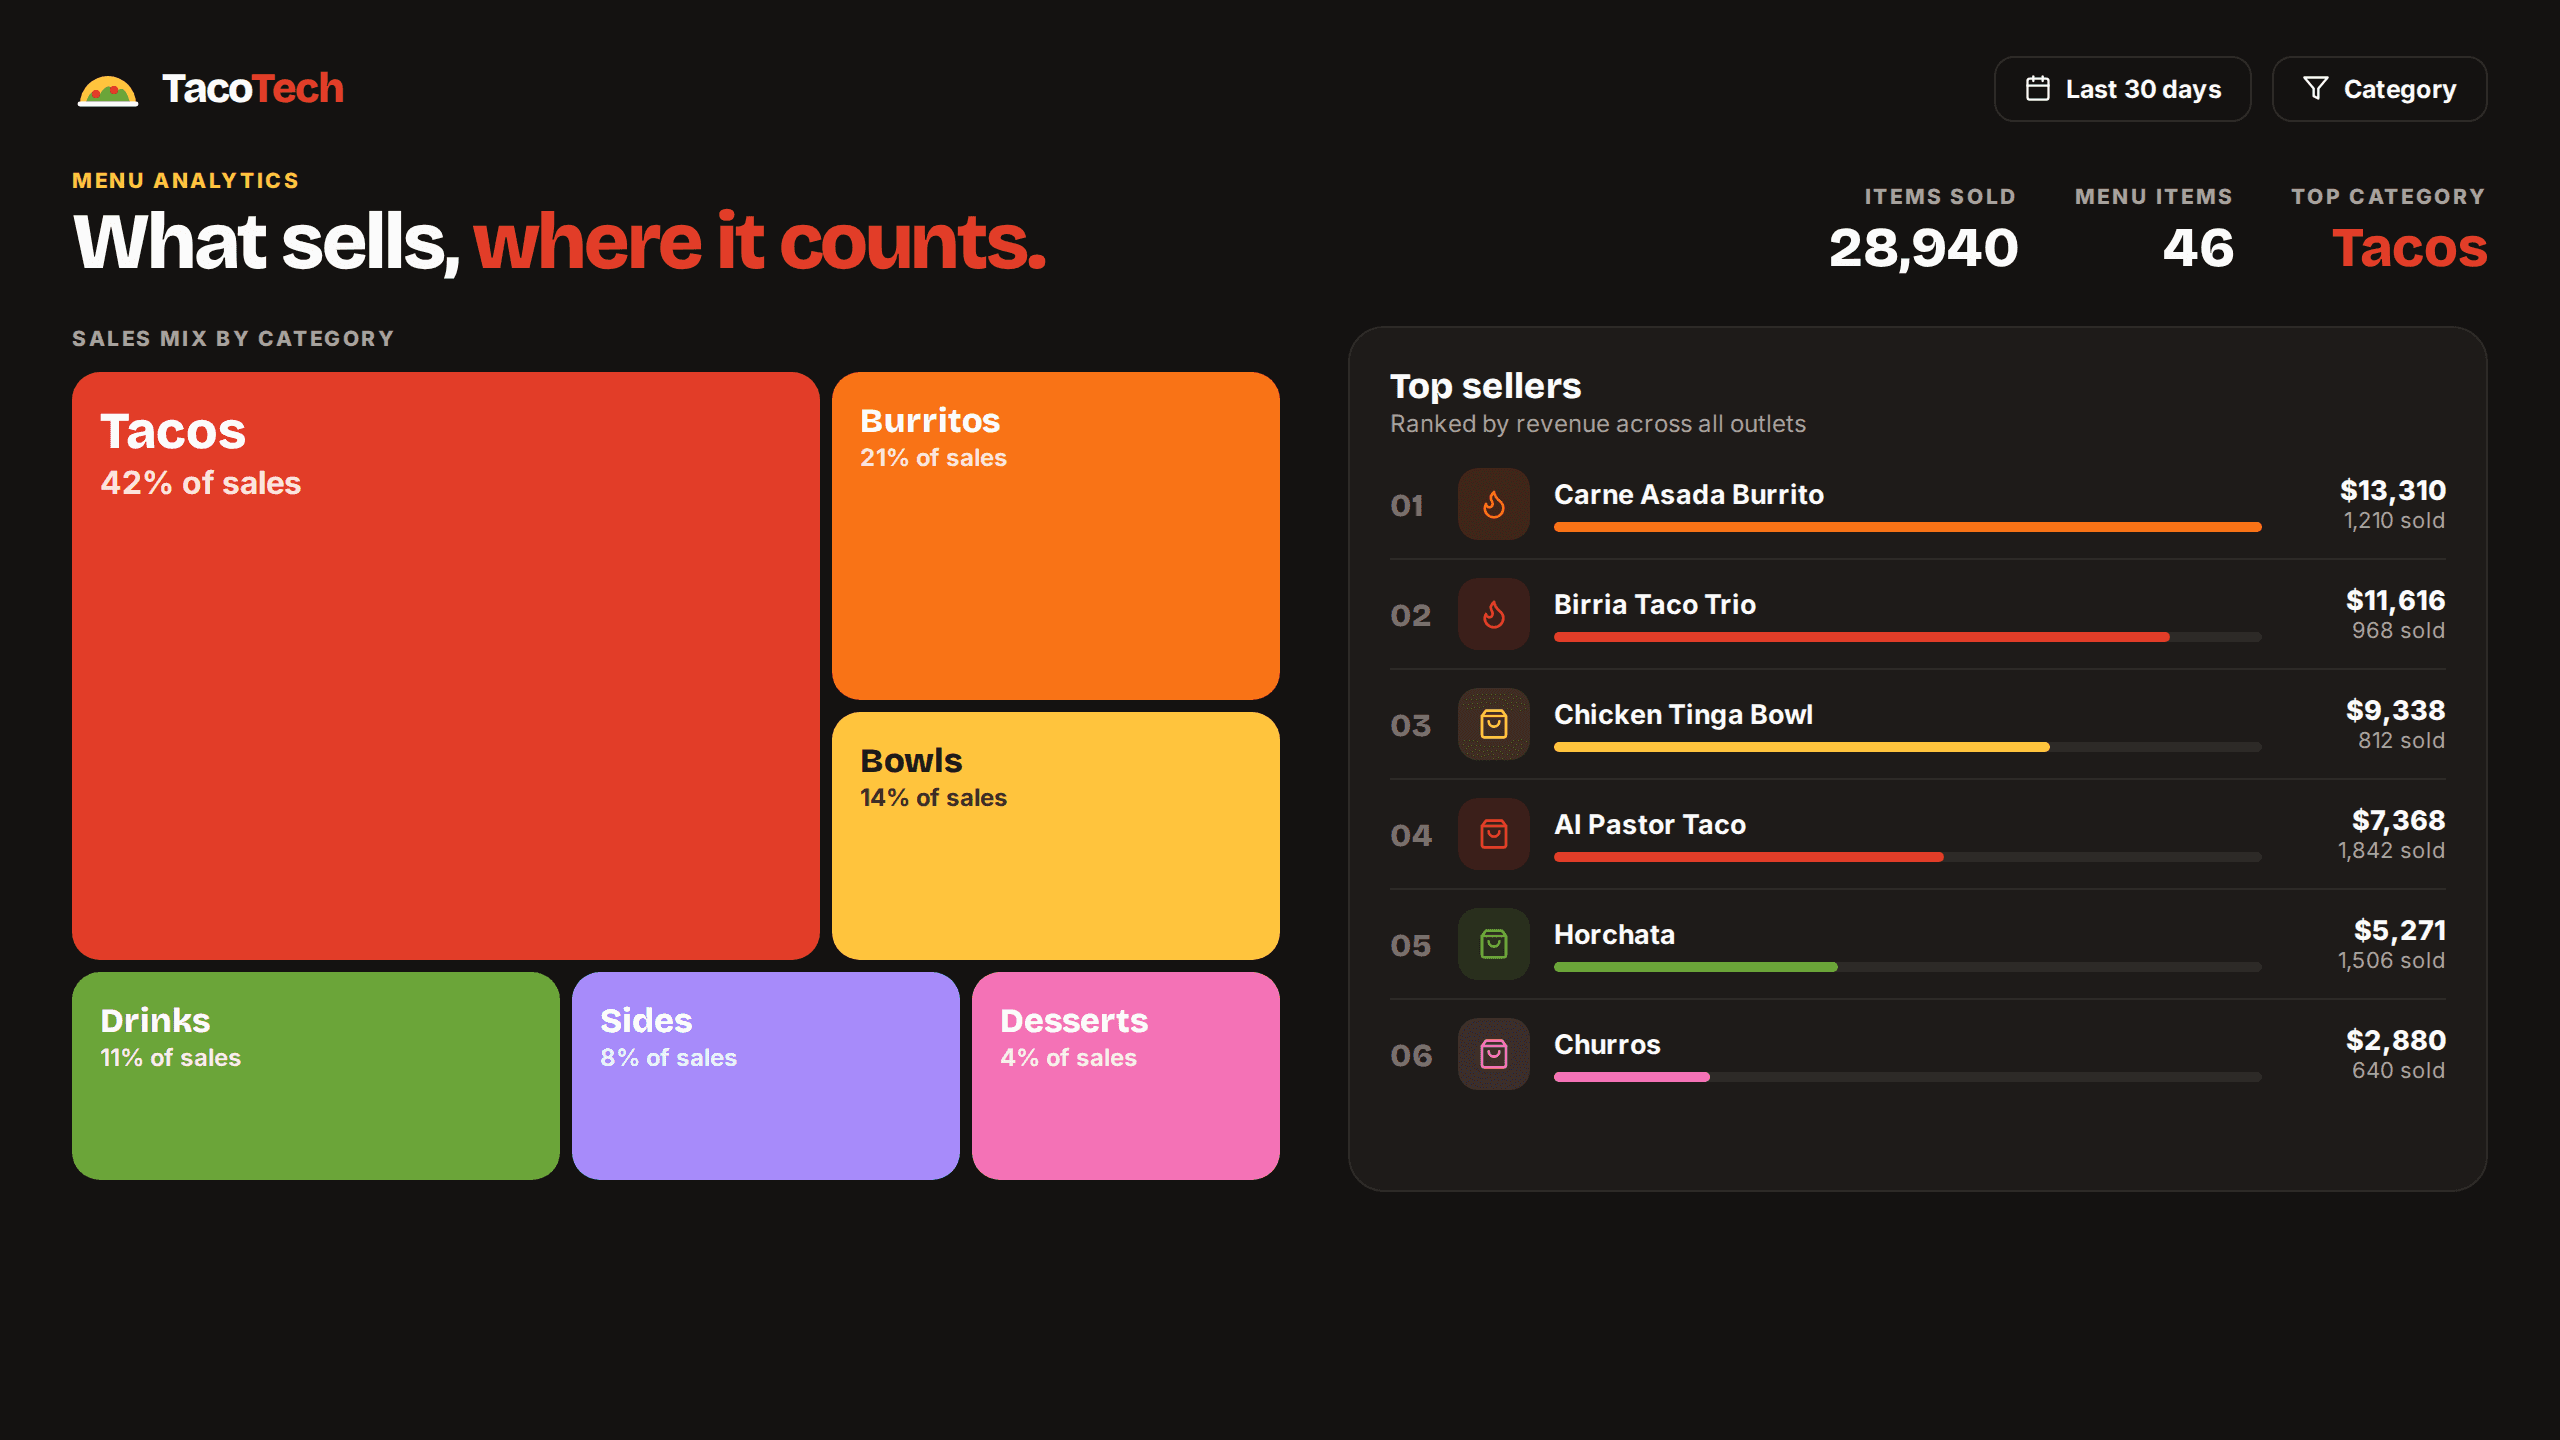
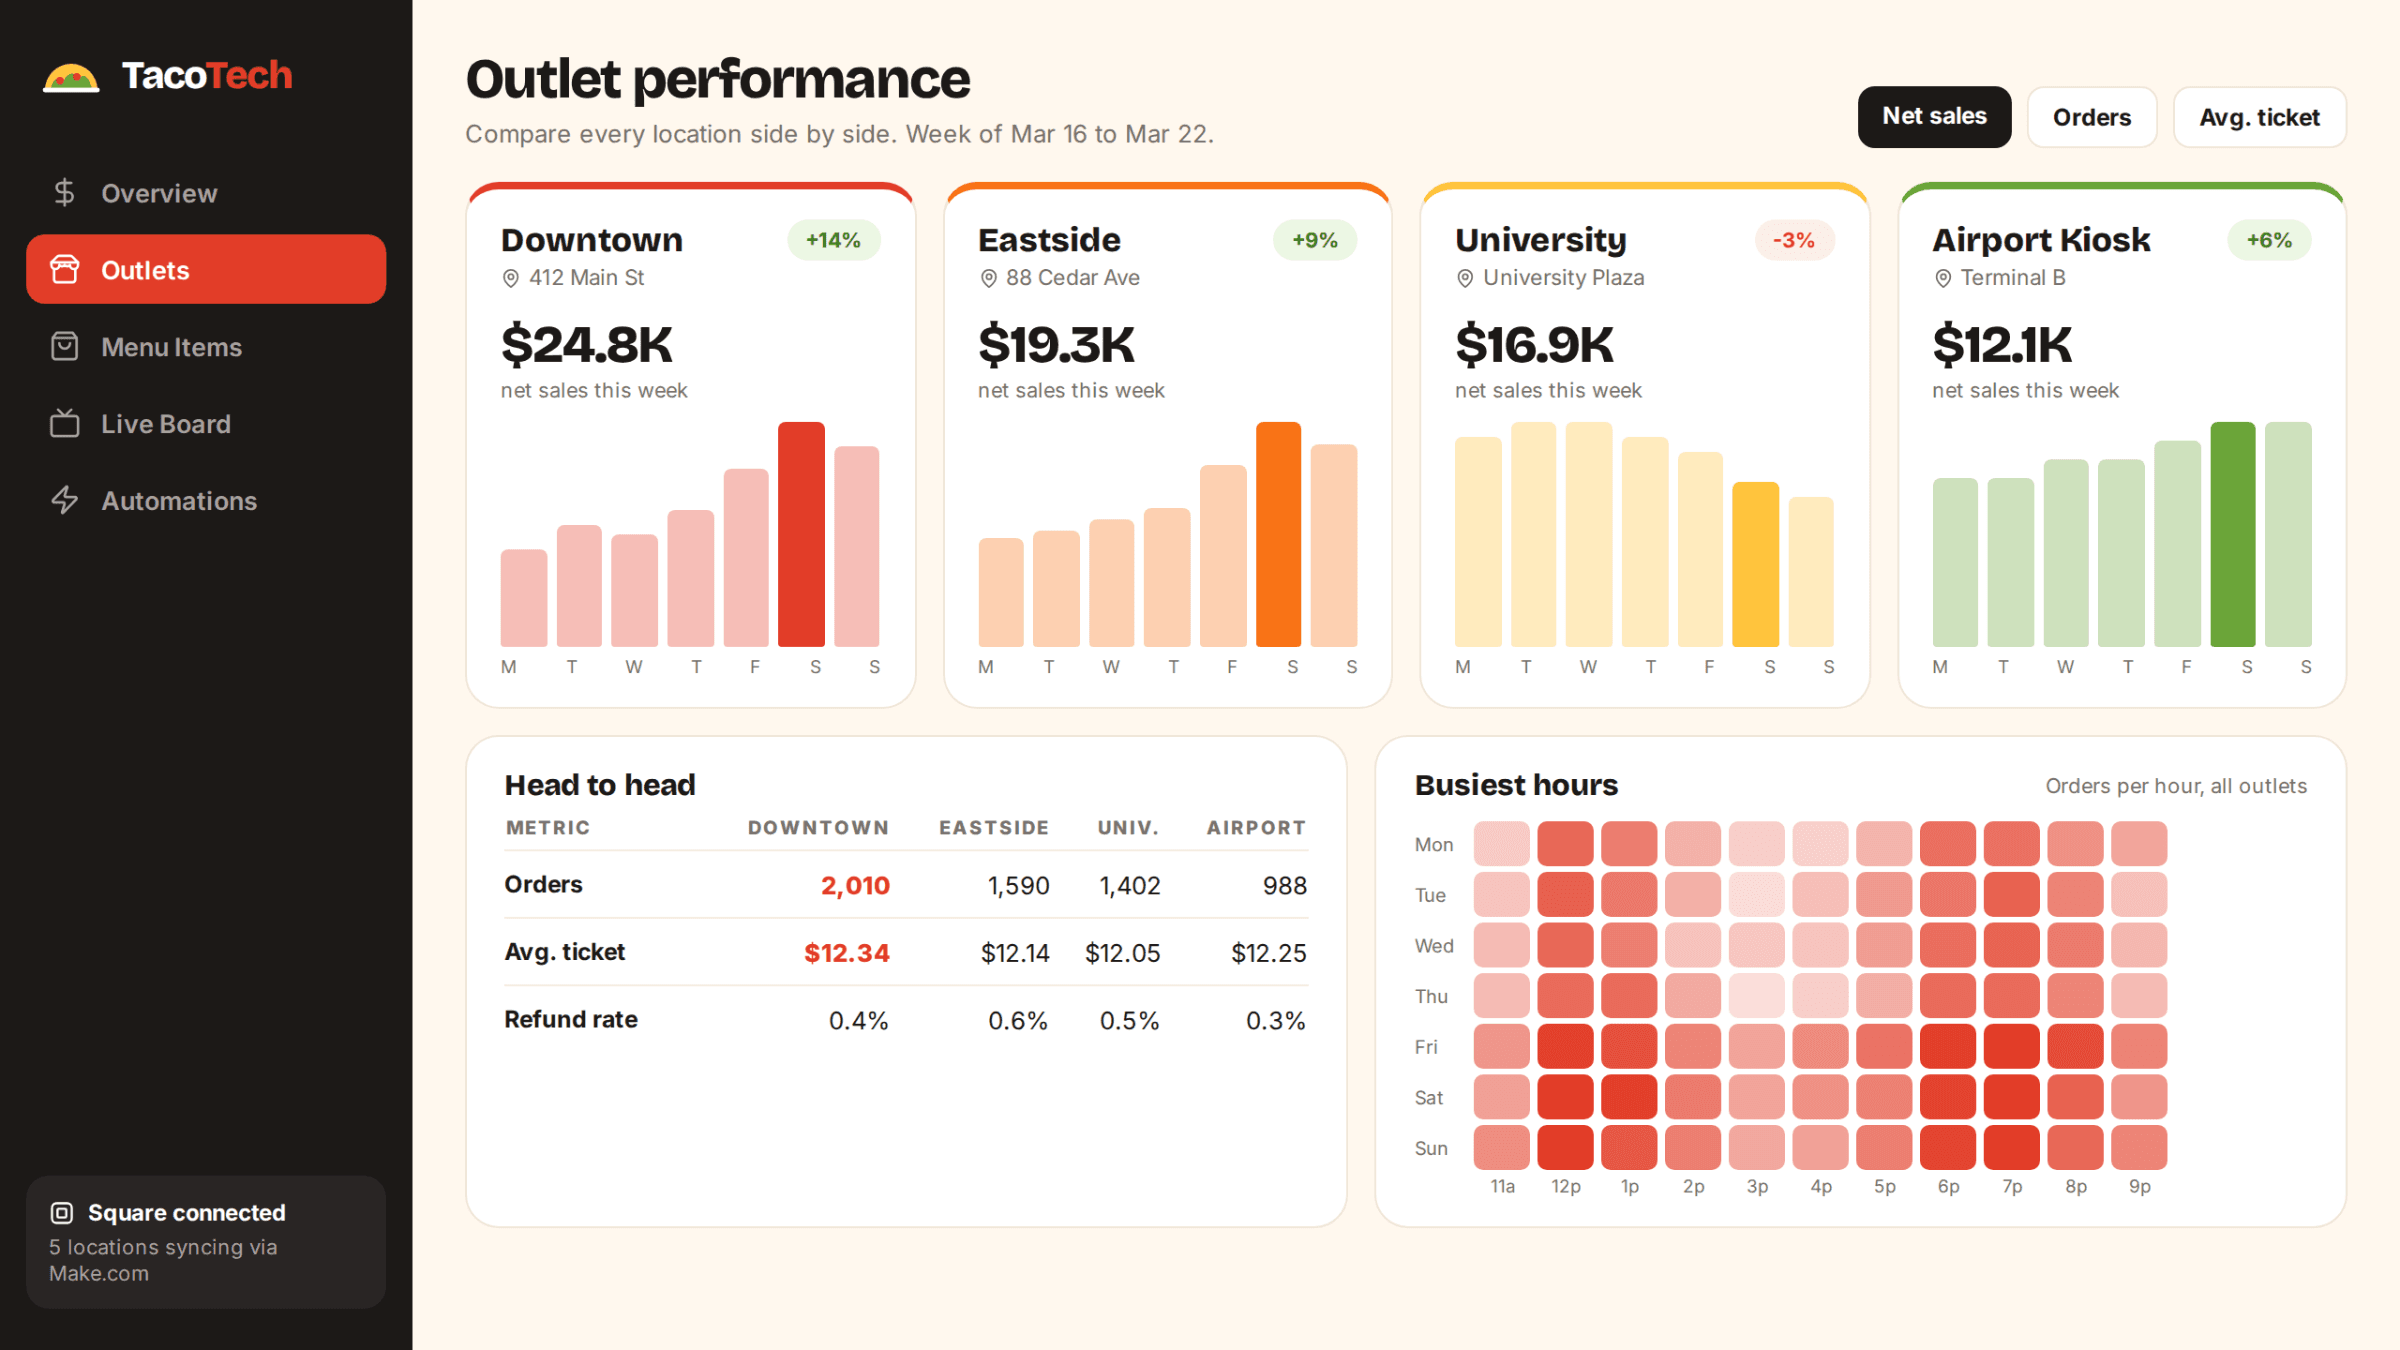
Taco Tech’s analytics dashboard was designed to automate and visualize business data from Square using Make.com. The automation workflows were built to fetch and update real-time data, eliminating manual reporting tasks. Key metrics—such as total sales, order trends, and performance by outlet—are now visualized in an intuitive Softr dashboard. The dashboard also includes graphs, KPI summaries, and interactive filtering. The system runs seamlessly with minimal supervision, offering a significant improvement in operational efficiency and data transparency for management.
Topics
- Retail, F&B & Local Business
- Square
- Make.com
- Softr
- CustomJS
- Google Drive
- Food and Beverage
- Client Portals
This was a client portal development build. See what a build like this costs, or hire a Softr developer to do the same for you.
Want something like this?
Tell us what you're building. First conversation is on us. Fixed quote in 24 hours, mutual NDA signed on request.